
getting started
Hacking the PHP Runtime System
First things first. Working on the PHP runtime system is not for the faint of heart. It consists of a large body of highly optimized C and assembly code, enlightening comments are usually scarce, and you may even come across variable names in Hebrew (ok, just one, but still). Also, virtual machines and compilers are not trivial technologies. So why bother getting into this stuff? Well, there's reasons. Here are some to choose from:
- You like a good challenge once in a while
- You are a PHP coder and want to improve the language
- You like a small informal developer community that you can learn from
Every developer has their own list of wishes for the languages that they use. I'm sure you do, too. PHP is developed by a small group of mostly spare time coders. It is quite easy to get involved. Anyone can pitch an idea, write an RFC and bring it to a vote.
To get a sense of what the community is like I can highly recommend joining the internals mailing list, lurk around for a while and gradually start participating in conversations.
In this post I will try to give some pointers to get started, nothing more and nothing less. You will see how to compile the source code, run it and debug it using an IDE (CLion). I will show you where to find the most important components that you will want to tinker with and how to start exploring from there. An explanation of some obscure internals slang used in the code should help you start making sense of it all.
In spite of my efforts an Alice in Wonderland experience is probably unavoidable. Just make that add to the fun!
CLion setup
Ultimately, improving the language likely requires writing some C code. This is probably the most intimidating thing to get started with. So my suggestion would be to be brave and create a local check out of the Git repository now:
git clone https://github.com/php/php-src
There, you just took your first step! Now we need to do something with that code. Personally I like a good IDE. In this post I will use CLion, which is my favourite IDE for C coding. This IDE is not free, but it is inexpensive, well worth the money, and you can try it for a full month before deciding to purchase it. So, go ahead and install it. On a Debian based machine, this can be done using Snap:
snap install --classic clion
Did I mention you might need some basic C and compiler development tooling as well? Be sure to install those too:
apt-get install pkg-config build-essential autoconf automake libtool gdb \
                bison re2c
CLion mostly targets cmake projects. Unfortunately the PHP runtime is still makefile based. This means that we need to deviate a little from the regular CLion setup. Makefile projects are supported, but it is difficult for an IDE to figure out the structure of such projects automatically. As a result CLion will have trouble analysing the source code and many of its smart features will not work.
The solution to this problem is to create a compilation database. A compilation database is a JSON file that contains information about the structure of the code base and how to compile it. We will generate one before we create a project in CLion. This is done using a Python tool called compiledb. We can use Pip to install it, like this:
pip install compiledb
This little tool can intercept the compile commands run by the make files. Instead of running make directly, we have compiledb run it:
compiledb make
So we will make sure to fully compile the PHP runtime using compiledb first. Compilation requires some development packages which can be installed using:
apt-get install libxml2-dev libsqlite3-dev
Now, the basic procedure is pretty standard:
./buildconf
./configure --enable-debug
compiledb make
Note the use of the --enable-debug flag to obtain a build that is suitable for development. When compilation is done, you will find a file called compile_commands.json in the root of the source distribution. This is the compilation database we need.
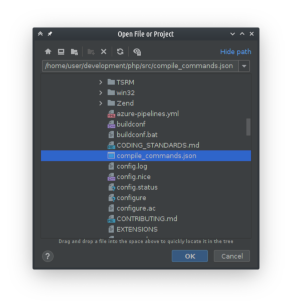
Now we can open the compilation database in CLion. Just choose "Open" from the File menu and point it at the compilation database:
Next, choose to open the database as a project, not as a file. After opening, CLion will show the README and start analysing the code:
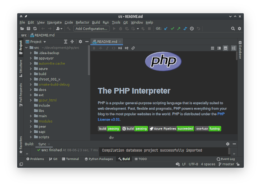
The screenshots here are from CLion 2021.1. Note the console message about the compilation database being imported. That is your confirmation of success. Code analysis will take a couple of minutes to complete before all the code inspection goodness kicks in.
Running and Debugging
Now that we are fully set up for code editing, let us continue to our next goal: Using CLion to run the PHP CLI. This requires that we create a run configuration in CLion. In the toolbar at the top of the window, click Add Configuration.... The resulting dialog looks like this:
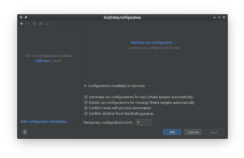
Click Add new... and choose Makefile Application. In the configuration dialog we need to provide some details. First of all, it needs a Target. A Target tells CLion how to build the executable. The dropdown here is most likely to be empty, so click the gears to create a new one. A new dialog appears, titled Custom Build Targets. Click the + icon to create a new target and give it a name. The dialog looks like this:
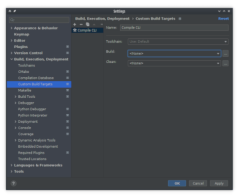
At the very least we need to specify the Build tool here. Again, the Build tool drop down will most likely be empty. Click the button on the right to define one. Yet another dialog appears titled External Tools:
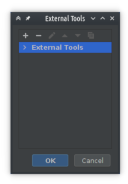
Click the + button to create a new tool. Believe it or not, yet another dialog appears. This dialog allows us to specify the command and command arguments to run in order to build the application. After filling in the required information the result should look like this:
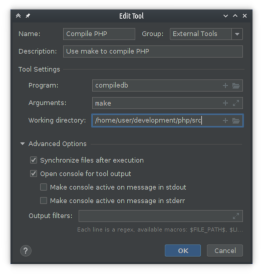
As you can see we chose to run make through compiledb, just as we did manually. This ensures that the compilation database is kept up to date as changes are made to the code base. Confirm to close the dialogs until you get back to the Run Configuration dialog. Here we specify the location of the PHP CLI executable. When that is done the dialog should look like this:
Note that we specified the --version argument. This causes the PHP CLI to print version info and exit rather than waiting for input. Click OK to close the dialog. In the main CLion window we can now see our new run configuration in the drop down and both the run and debug buttons light up green:
Pressing the run button should now run make to compile the PHP CLI and run it. The terminal output then shows the result:
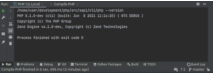
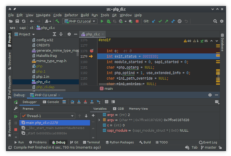
The next thing to try is running through GDB and triggering a break point. The entry point of the PHP CLI, which is the main() function in sapi/cli/php_cli.c, is a good place to set a break point by clicking in the gutter of the editor. Now, when we hit the debug button we can see that the break point is triggered:
Remote Debugging
Why would anyone need remote debugging when working on the PHP runtime on their local computer? The answer: Docker.
There are various advantages to keeping your build environment (compiler, build dependencies, ...) in a Docker container. You can set up a Docker container exactly as you need it to be without messing with your desktop operating system. Also, you can use multiple Docker containers with different Linux distributions and library versions installed, which is great for testing. And you get all of that at a tiny fraction of the resource cost of a traditional virtual machine.
But using Docker has disadvantages too: The executable is no longer running on the same logical machine as your IDE. This is why we will also take a look at setting up remote debugging.
To set up remote debugging, make sure your container has gdbserver installed. On Debian based containers this is as simple as adding
RUN apt-get install -y gdbserver
to your Dockerfile. Initiating a debug session for the PHP CLI should now be done from outside the IDE. You need to run the executable first, using gdbserver. This will cause gdbserver to pause the executable until a debugging client like CLion connects to it. Having your container run the executable can be done by issuing a command similar to:
docker run -ti --rm --net host \
-v $PWD:/$PWD \
--security-opt seccomp=unconfined \
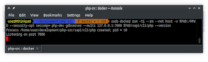
php-dev gdbserver --multi 127.0.0.1:7000 $PWD/sapi/cli/php --version
Here we assumed that the command is issued from the root of the PHP source. We also made sure that the container is bound to the local host, which simplifies connecting to gdbserver from CLion. We added a security option to allow GDB to disable address randomization for easier debugging.
Note that we map the local source code directory to the exact same path inside the container. This is needed because when GDB notifies CLion about a breakpoint being triggered, it will send the path to the file along with it. When the GDB process inside the container has the source code in a different location than CLion does, then CLion fails to correlate the GDB message to the correct source code file. So we need to make sure that the source code files inside and outside the container have identical paths.
There is one more detail to take into account. The path information is baked into the executable during compilation. That means we also need to make sure that configuring and compiling PHP is done with matching paths. If you do not get this right, your break points will not trigger.
Now, running the container shows gdbserver waiting for connections on port 7000:
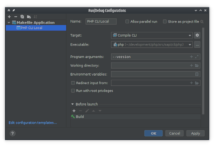
The next step is to tell CLion to connect to gdbserver. We can do that by adding a Run Configuration. From the Run Configurations dropdown in the main toolbar click Edit Configurations. In the dialog that pops up choose to create a GDB Remote Debug configuration. Then, choose 127.0.0.1:7000 as the remote and select the PHP CLI as the symbol file. When that is done, your dialog should look like this:
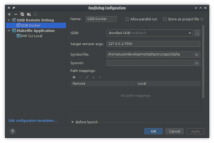
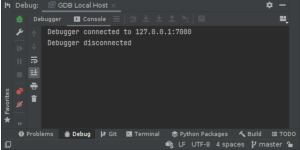
Give the configuration an appropriate name and click OK to confirm. Now, with gdbserver waiting for a connection in the background, we can start the remote debug run configuration in CLion. If all is well, this should trigger the breakpoint that we placed in main(). In case you removed that breakpoint again, you will just see CLion connect and immediately disconnect in its debug console:
Getting to Know the Code
Now that we are fully set up for coding, let's get started!
Not so fast. I have some good and some bad news for you. The bad news is that the code base of the PHP runtime is pretty large. The good news is that you likely only need to make changes in a tiny fraction of it in order to implement a language improvement. The changes are likely to hit one or more of a small group of files that contains the most critical bits. I will mention a few of them in a moment.
Runtime Phases
First, it is useful to coarsely know the various phases that the PHP runtime operates in. These phases translate into different sets of source code files that implement them.
- Language Scanning
- A PHP source file is first processed by a language scanner. A language scanner splits the source into a sequence tokens, like strings and keywords.
- Parsing
- A parser is used to transform a token sequence into a hierarchical structure called an Abstract Syntax Tree (AST).
- Compilation
- The compiler generates opcodes from the AST. The opcodes are the low level instructions executed by the PHP Virtual Machine.
- Optimization
- The opcode sequences are in turn processed by various optimizers.
- Execution
- Finally, the opcode sequences are executed by invoking opcode handlers. Each opcode has an associated handler. Traditionally this is a C function that implements the opcode. Today, PHP also features an integrated JIT compiler which provides alternative opcode handlers that output machine code.
The Core
The files that constitute the core of the PHP runtime are all found in the Zend/ subdirectory and include the following:
- zend_language_scanner.l
- The PHP language scanner (in re2c syntax)
- zend_language_parser.y
- The PHP language grammar in Bison format
- zend_compile.c
- The PHP compiler
- zend_execute.c
- Contains execution support functions
- zend_vm_def.h
- Contains the opcode handlers
The language scanner is generated by re2c using zend_language_scanner.l as input. The parser is generated using Bison using zend_language_parser.y as input. Touching just these two files may be sufficient to introduce new syntax in PHP.
The PHP compiler is found in zend_compile.c. In case you want to make an improvement to the PHP language that requires changes in the opcode sequences generated by PHP you likely need to make adjustments there.
The opcode handlers focus on one task: Figure out what to do by inspecting the arguments of a particular opcode and translate this into low level operations on the Virtual Machine. The opcode handlers can be found in zend_vm_def.h. That's right, one huge file containing the handlers for all opcodes. And it is not even the actual, proper C implementation. The actual opcode handling code is in zend_vm_execute.h, which is generated from zend_vm_def.h. The reason why the actual handlers are generated is that each handler in zend_vm_def.h may generate multiple handler variants in zend_vm_execute.h. These variants are specializations which allow the virtual machine to invoke a more efficient handler for a particular opcode depending on how it is used.
Finally, the opcode handlers delegate to a collection of functions in zend_execute.c. These functions perform the actual operations on the virtual machine. Reading and writing of variables, throwing exceptions, executing method calls, this is the place where it all happens. A great resource on how the PHP Virtual Machine works is this blog post by Nikita Popov.
Internals Slang
When studying the PHP runtime source code you will quickly learn that there is some specific terminology that you are obviously supposed to be familiar with. Let us introduce you to some of those.
- zval
- Any variable in a PHP script is internally represented by a data structure called a zval. There are loads of macros that deal with zvals. Typically, these macros have names starting like
Z_orZVAL_. A great resource on zvals is this blog post by Nikita Popov. - CE
- A CE is a Class Entry, which is a data structure representing a class in PHP.
- oparray
- An oparray is a sequence of opcodes. After compilation any PHP function or method has an associated oparray holding its opcodes.
- CG
- The name of a frequently used macro for accessing the Compiler Globals. This is a global data structure that is used by the PHP compiler while compiling scripts. The data structure holds things like the current line number, the current CE, the oparray that opcodes are written into, and so on.
- EG
- Another name of a widely used macro. Its role is similar to that of CG but for a different data structure: the Execution Globals. This data structure supports the execution phase rather than the compilation phase. It contains the list of available classes, functions, the current stack frame, the symbol table, and so on.
- EX
- This is the name of a commonly encountered macro that accesses the current execution context. It contains things like the current value of $this and the currently executing function.
GDB as a Tour Guide
A convenient way to get to know your way around in a new code base is to get yourself onto a free tour. Basically, it works like this:
- Write a really small PHP script that performs some operation that you are interested in
- Set some break points in the PHP runtime that you think may get triggered while executing your PHP script
- Run the PHP script using GDB
- Use step debugging to follow the code path executing your script
For example, you might want to know how the PHP virtual machine executes adding two integers. To figure that out, write a PHP script that contains nothing but a simple addition, set some breakpoints in places inside zend_execute.c that appear to be relevant and run the script.
Hint: You may run into the optimizer doing smart stuff like executing your code in a different way or not executing your code at all. It can be helpful to disable all optimizations by passing -d opcache.optimization_level=0 to the PHP CLI.
In Closing
Of course there are many more things that are useful to know when hacking the PHP runtime, way more than a single blog article can cover. My goal was to get you started by providing some information that would have helped me out when I got my first look at the code. So I'm just hoping that I left enough of a challenge for you to try your brain on it. ;)
I will close this post by listing some great resources that may be helpful to you:
- PHP Internals website
- PHP Internals book
- Docs directory in PHP source code repository
- Derick Rethans – It's all about the GOTO
- Nikita Popov - Static Optimization of PHP Bytecode
- Nikita Popov - PHP 7 Virtual Machine
- Nikita Popov - Internal value representation in PHP 7 - Part 1
- Nikita Popov - Internal value representation in PHP 7 - Part 2
- Nikita Popov - How to add new (syntactic) features to PHP